

How to Value a Company with Multiples
How to Value a Company with Multiples
P/E, EV/ NTM Sales, EV/EBITDA - Which one should you use?
There are an abundance of financial ratios to analyze, but which one is best at valuing the real worth of a company? We’ll be taking a look at cybersecurity companies, such as Crowdstrike and Zscaler, and evaluating their EV/NTM Sales multiple, revenue CAGR, and gross profit margins.

Let’s take a look at 4 commonly used ratios and why 2 of these ratios may tell a better story than the other 2:
P/S (Price to Sales): Price/ Sales per share or Market cap/ Sales
P/E (Price to Earnings): Price/ EPS (earnings per share) or Market Cap/ earnings
EV/ NTM Sales (Enterprise Value/ Next Twelve Months Sales): (Market cap + debt - cash & cash equivalents)/ Next 12 months estimated sales
EV/ EBITDA (Enterprise Value/ Earnings* before Interest, Taxes, Depreciation, and Amortization): (Market cap + debt - cash & cash equivalents)/ Earnings* before Interest, Taxes, Depreciation, and Amortization
*Earnings is the amount of profit left after all expenses have been paid, mostly synonymous with net income.
Before diving in, let’s compare using Market Capitalization in our ratios versus Enterprise Value.
Market Cap: Share price x Shares outstanding
Enterprise Value: Market cap + Debt - Cash & Cash equivalents
Notice what Market Cap is missing? It doesn’t include a company’s debt. Debt is inherently included in the value of a company, because if a company were to be bought out, the buyers would have to take on the debt obligation. Both the P/E and the P/S ratios don’t consider the amount of debt a company is obligated to pay. This is why I prefer to use the EV/ NTM Sales ratio over the P/S ratio, and the EV/EBITDA ratio over the P/E ratio, as it gives a more accurate representation of a company’s worth.
Cash and cash equivalents are subtracted in the EV formula because it is assumed they are already included when calculating market cap. Think of it like this: If you bought a company for $10,000, but that company had $2,000 of cash on hand, your “real” cost to buy the company would be $8,000 since you would have access to the company’s cash after buying it.
EV multiples are useful when compared against competitors within the same industry, AKA comparable company analysis. Theoretically, a lower multiple would signify a lower valued company, while a higher multiple would signify a higher valued company. However, this is often not the case, and when valuing a company, an investor should take into account many factors, such as profitability, gross profit margins, revenue growth, and future demand for a service/product, among many others. The graphic below shows the EV/NTM Sales of several cybersecurity names:
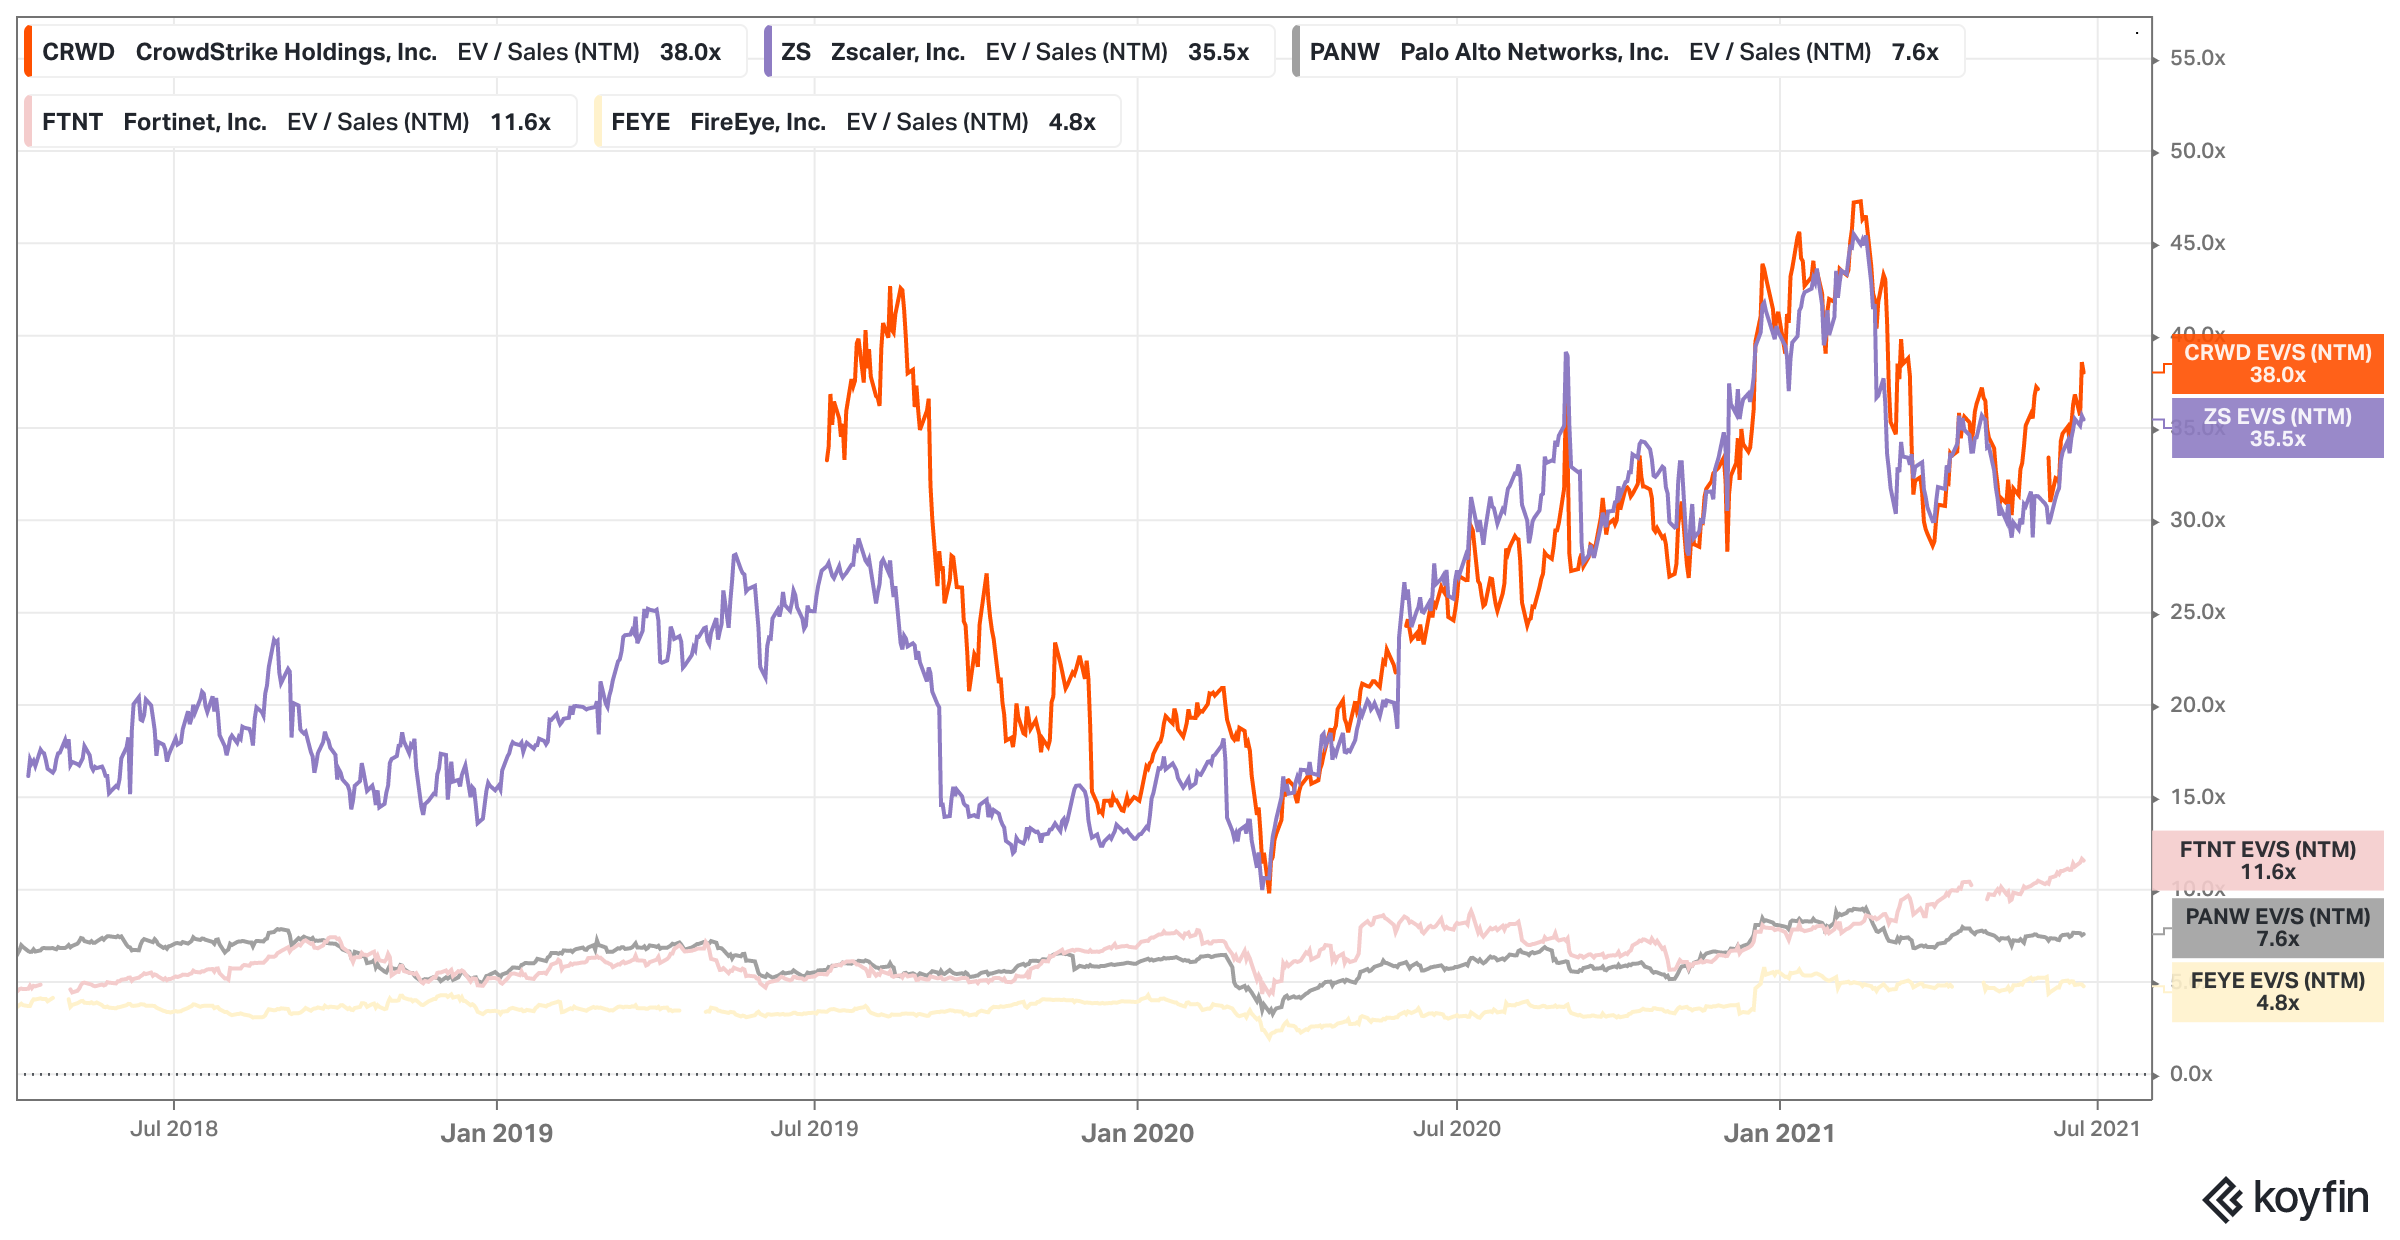
You can tell right away that there are 2 groups of extremes: CRWD & ZS both have high multiples above 35x, while FTNT, PANW, and FEYE all fall below 12x. If you solely used the EV/NTM Sales multiple to value companies, then you’d probably believe that the lower group could outperform the higher group since the lower group has a lower multiple. However, a single ratio or multiple can never illustrate the true story.
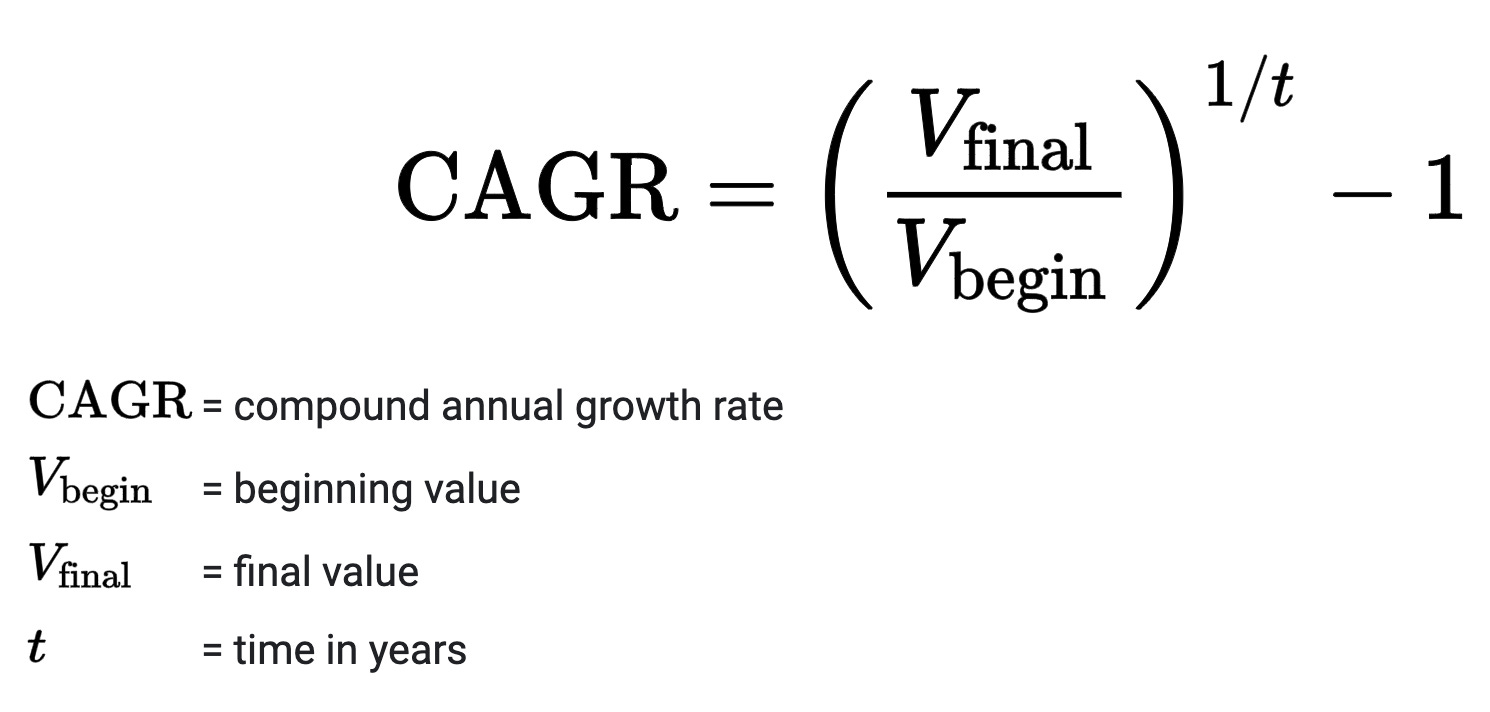
Let’s examine revenue CAGR (compounded annual growth rate). I have CAGR set on my charts to determine revenue growth year over year.
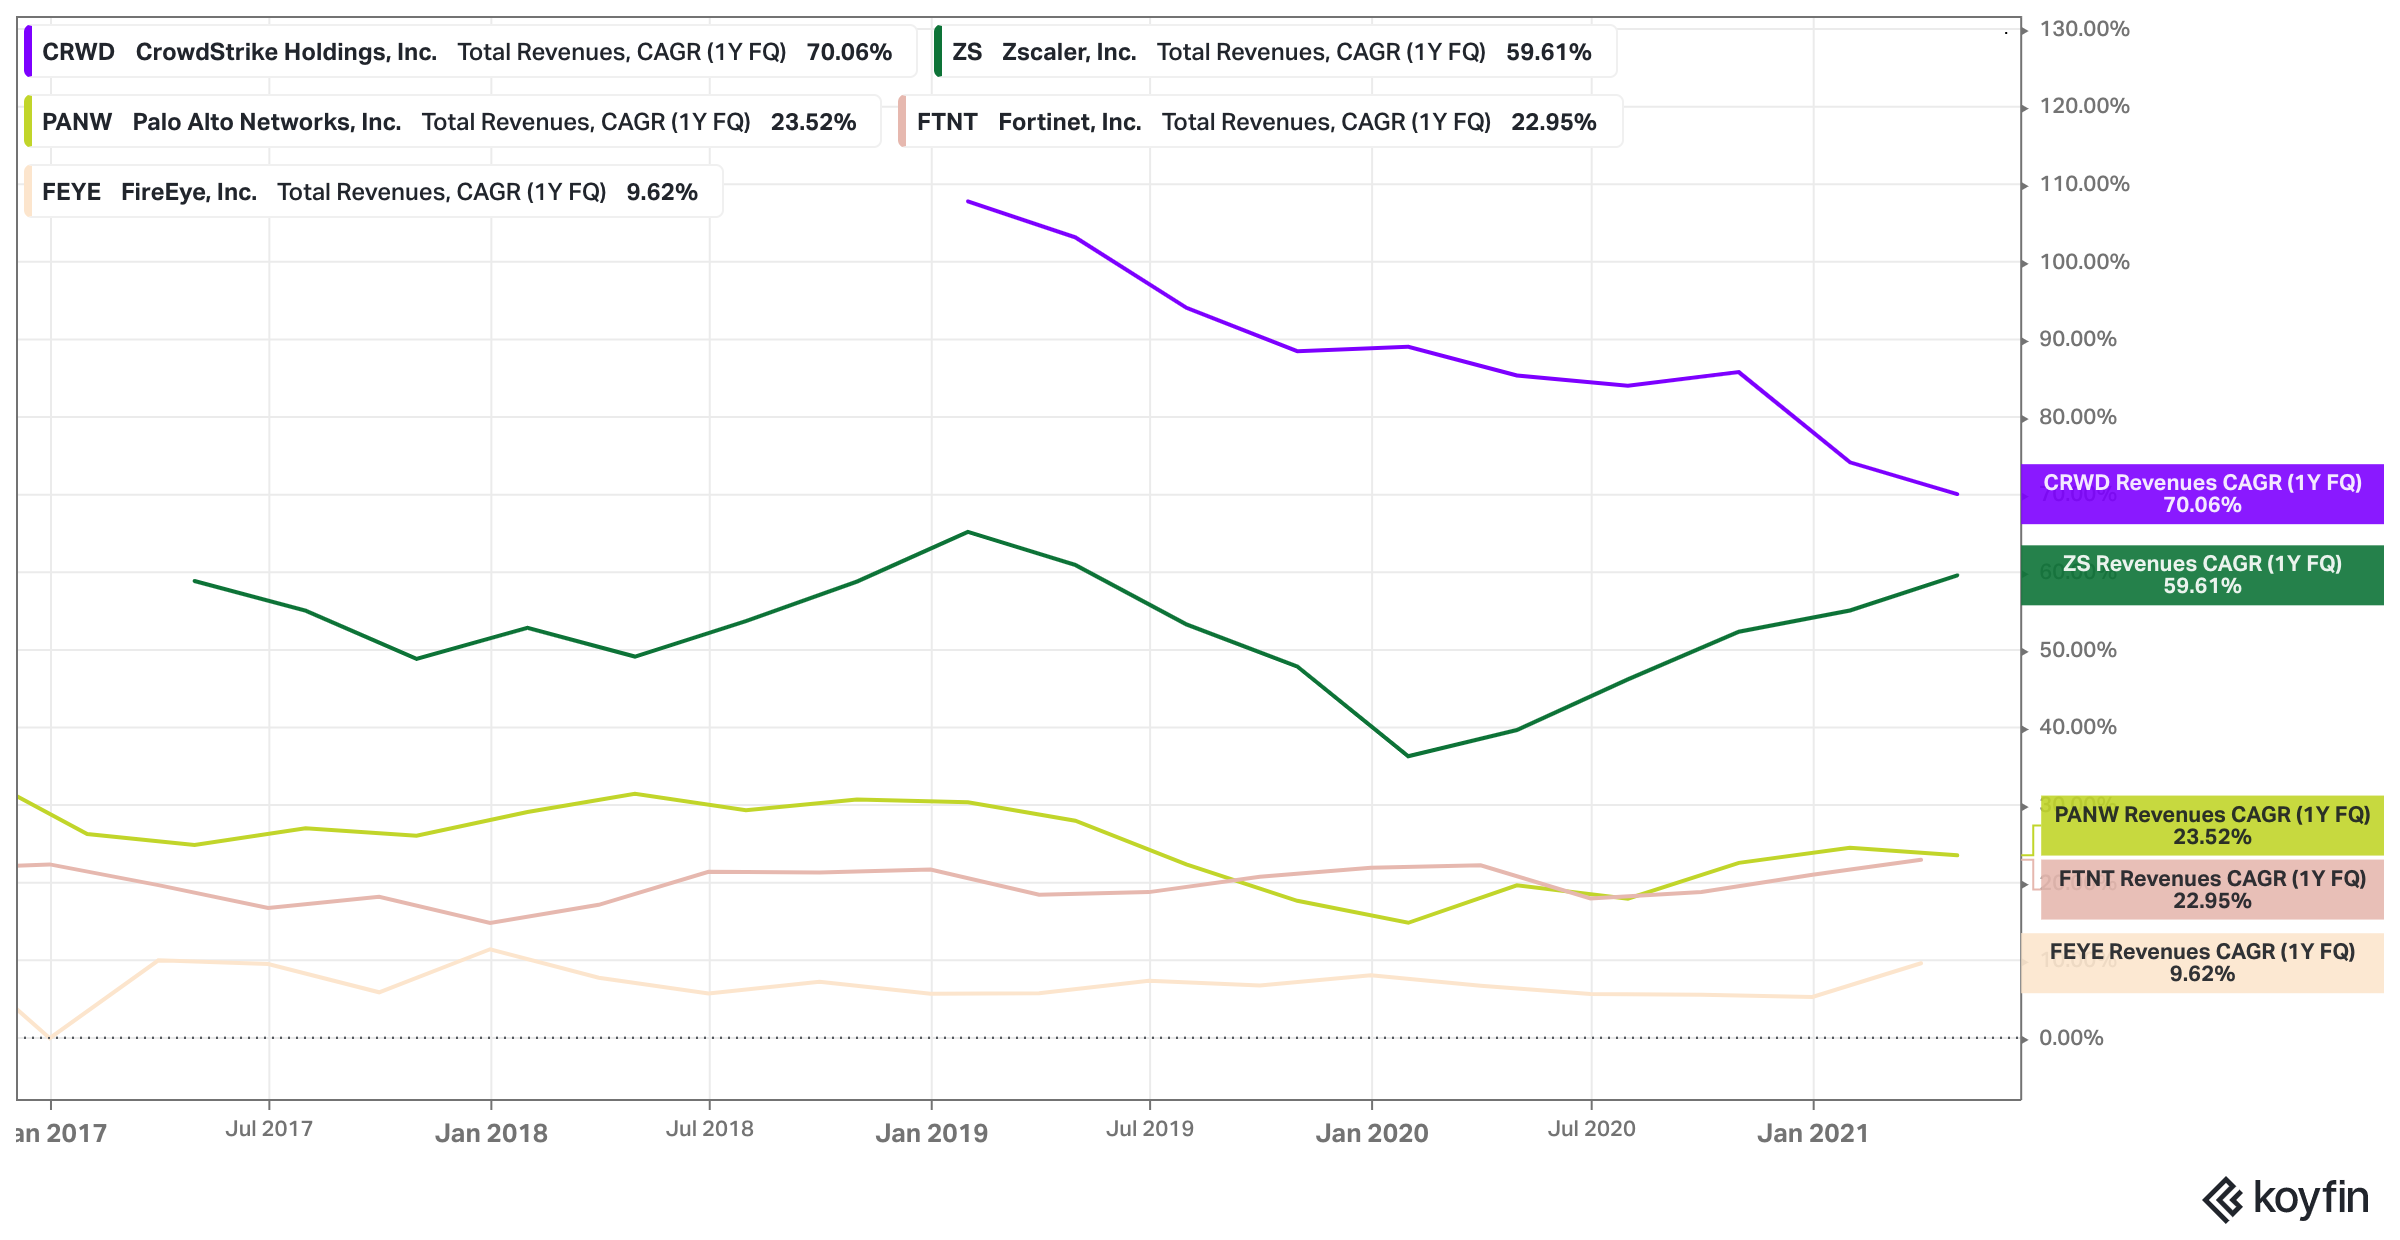
Again, there are 2 groups of extremes: CRWD & ZS with 55%+ CAGR and PANW, FTNT, and FEYE with 25% or less CAGR. It’s evident that a higher revenue CAGR will warrant a higher EV/NTM Sales multiple, as higher future revenue growth should be correlated with a higher EV/NTM Sales multiple.
A point of concern I have is that CRWD’s revenue growth seems to be slowing down since their IPO in 2019. Where the growth will stop and base will be indispensable to CRWD’s stock price. However, CRWD is still growing revenues at an extremely high pace.
ZS’s growth since early 2020 is a very healthy signal, as revenues have been growing faster every quarter. Finally, it’s observable PANW, FTNT, and FEYE’s growth has peaked, and their revenue CAGR has been stagnant since 2017.
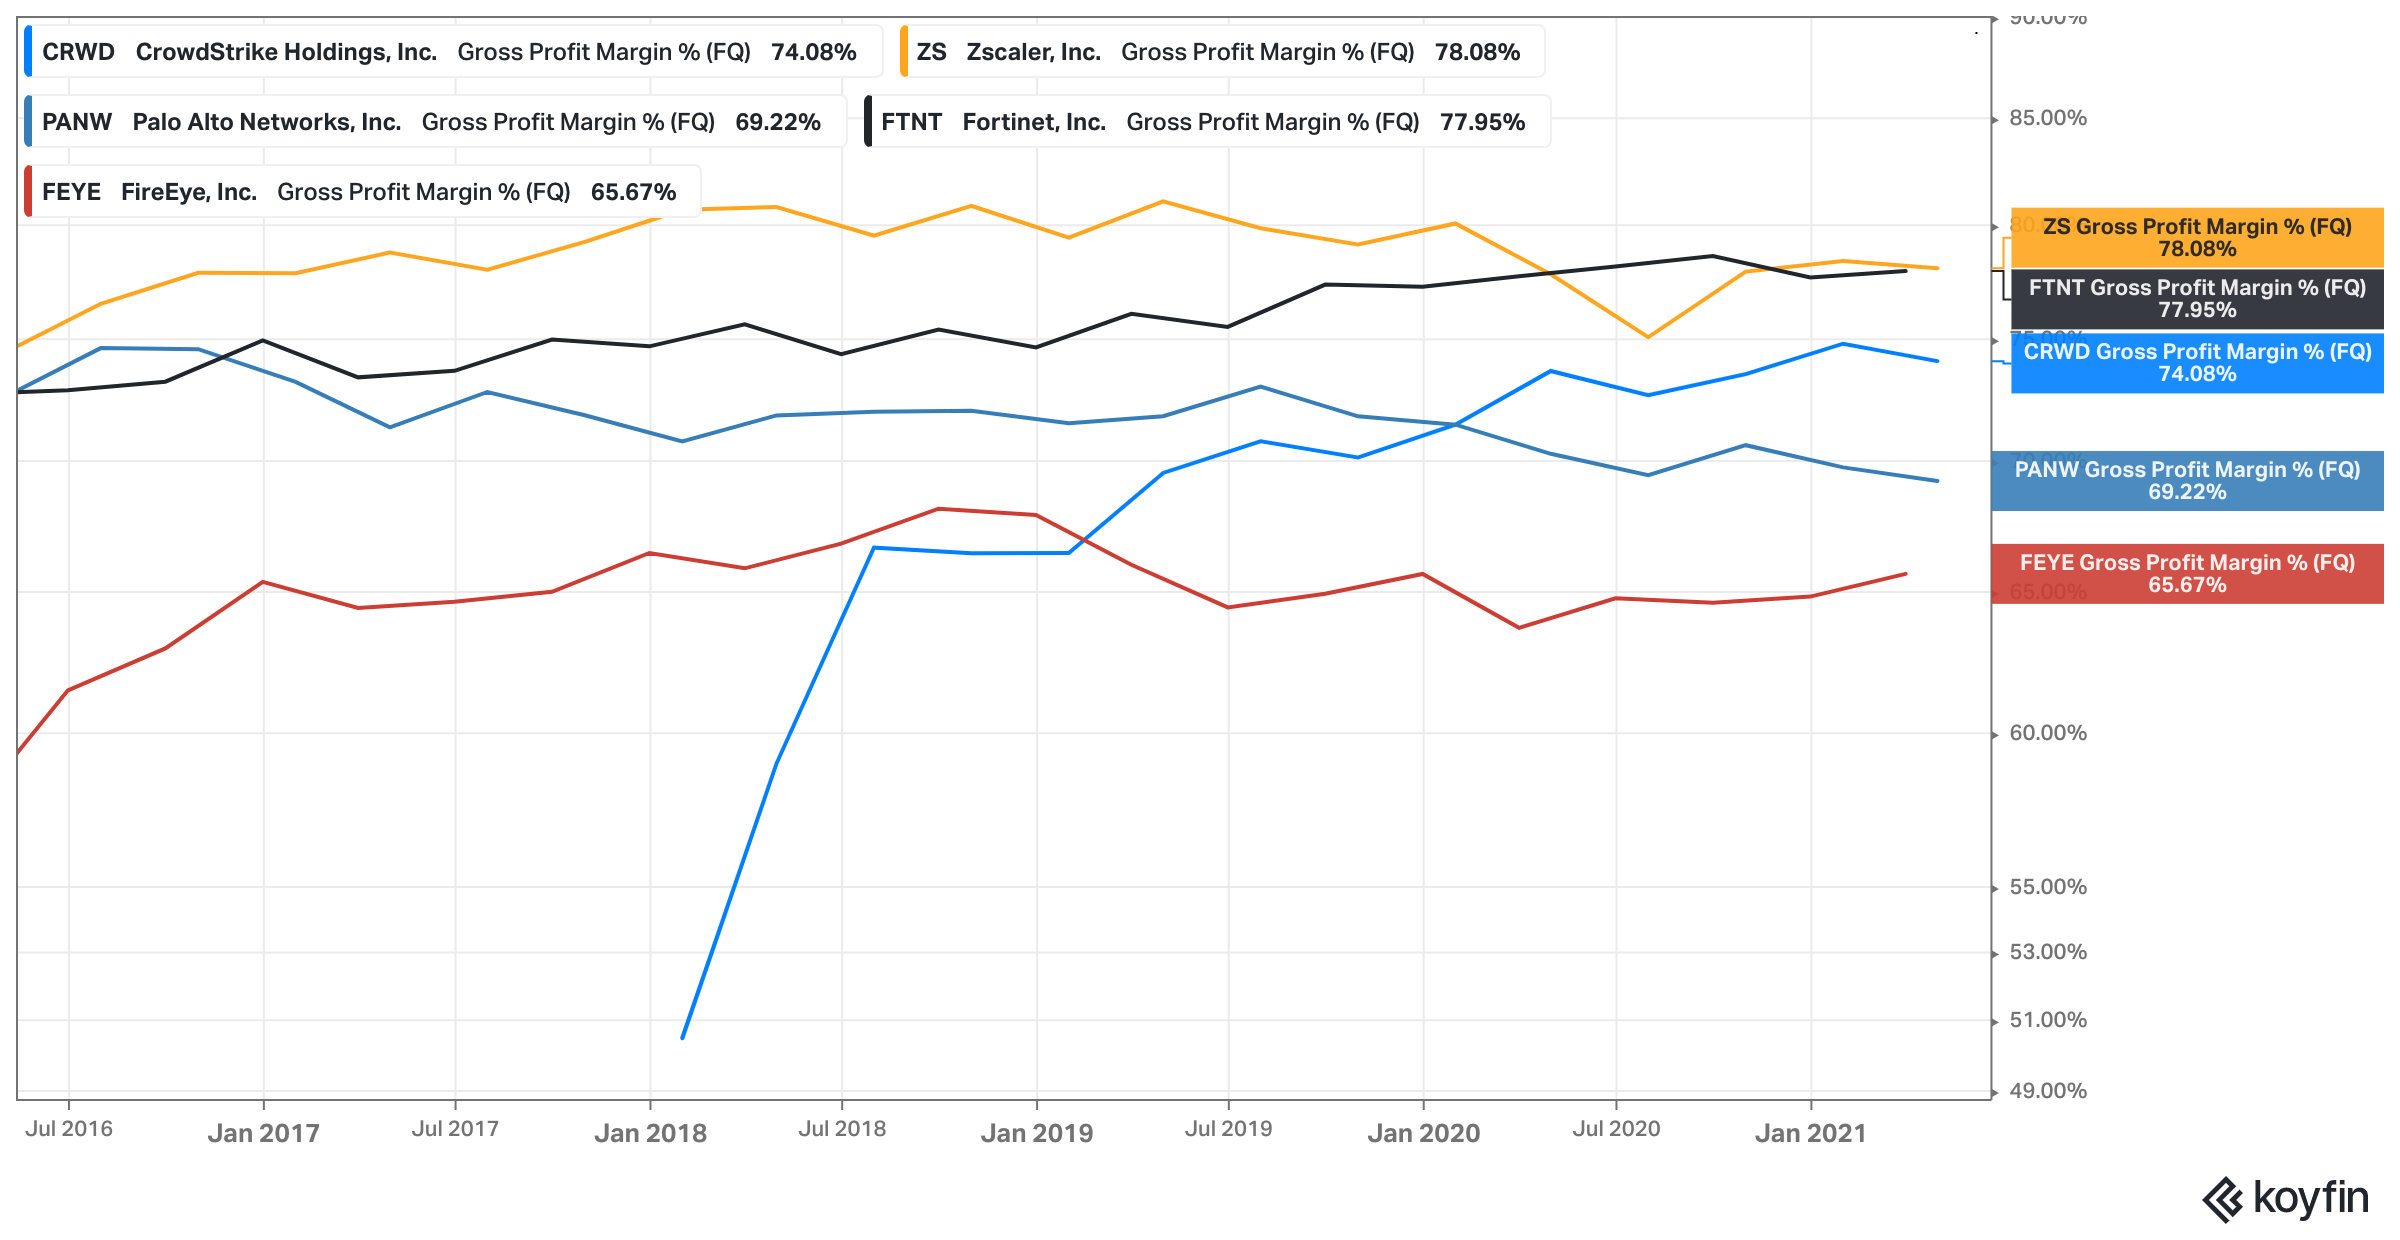
Revenue CAGR is extremely important, but so is gross profit margin %, which signifies the % of money a company takes home from their sales.
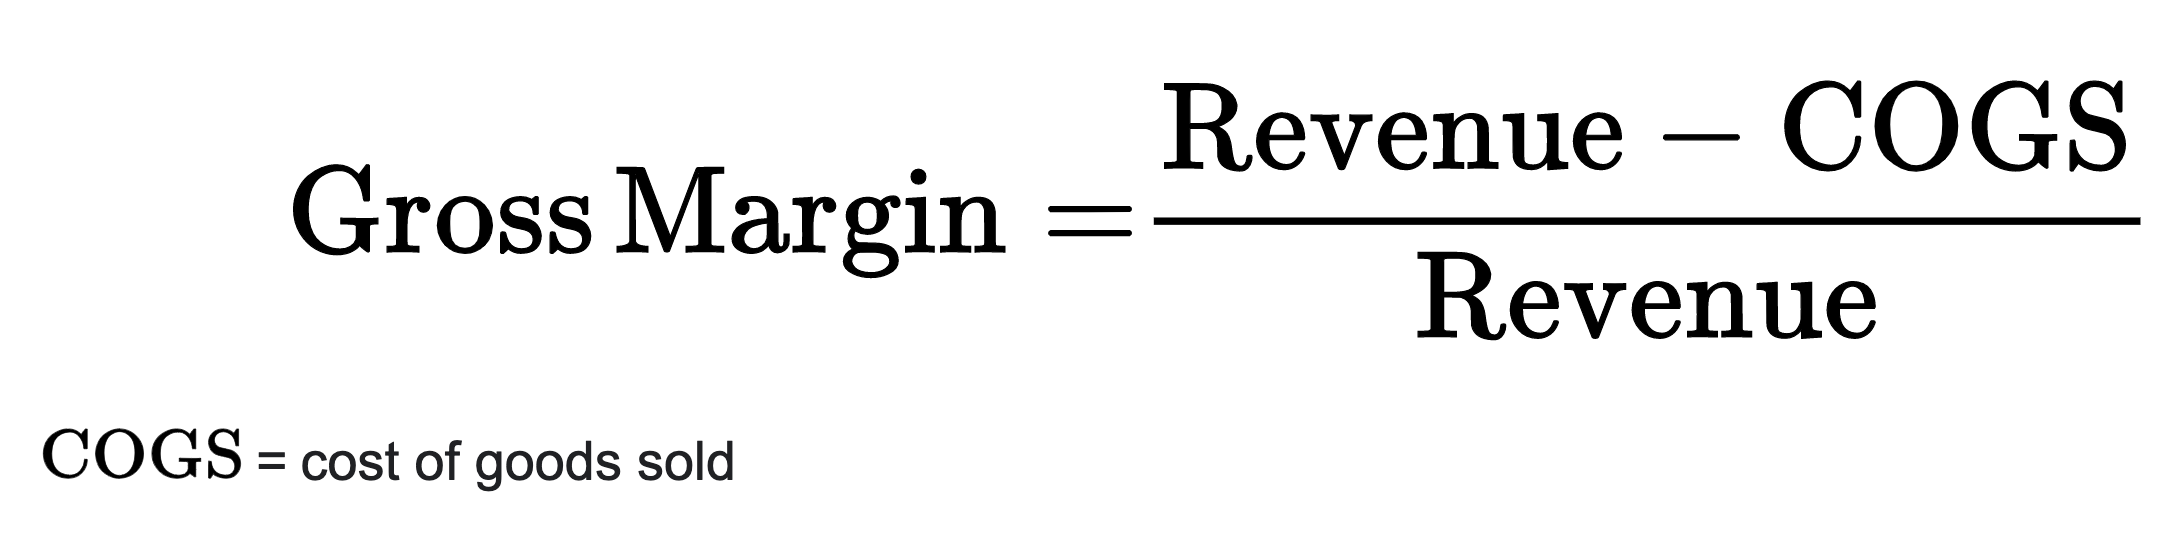
Surprisingly, all 5 companies fall within a range of ~12%, with ZS leading the pack at 78.08%. A “good” gross profit margin is considered 20% or above; this goes to show that the cybersecurity industry has extremely high profit margins and that companies should only be compared with competitors within their own industry. Given CRWD’s high EV/NTM Sales multiple, I would expect a higher ranked gross profit margin, but at the same time CRWD has also been increasing profit margins each year since their IPO.
High EV/NTM Sales multiple companies will most likely be backed up with high revenue CAGR and gross profit margins. These are just 3 variables among many that should be considered before making a purchase.
If you see this message, congrats, you made it! Feel free to send me topic recommendations, suggestions, or general questions. You can contact me by email: HedgeVisions@gmail.com, or by Twitter Messages @HedgeVision.
For Your Eyes Only - Hedge Fund Insights
Disclosure: Of the equities mentioned above, I am long CRWD and ZS via common shares.